Mergers & Acquisitions
Shortcut Excel AI automates M&A accretion/dilution models, reducing 45-150 minutes of manual work to 40 seconds—90x faster than traditional Excel modeling—by automatically calculating shares issued, pro forma EPS, and deal impact analysis.
Building accretion/dilution models in Mergers & Acquisitions (M&A) is essential to driving investment and strategic decisions for corporate finance teams, investment bankers, and acquirers.
These models allow decision-makers to understand how a transaction impacts the acquirer's earnings per share (EPS) and evaluate whether the deal is accretive (EPS goes up) or dilutive (EPS goes down) in the near term. This analysis plays a critical role in determining the viability of a deal, setting the maximum purchase price or valuation multiple, and optimizing the financing structure (cash vs. stock).
To successfully complete these models, deal teams must consolidate information across multiple sources—SEC filings, company forecasts, debt financing terms, tax assumptions, synergy estimates, and integration costs—to build a unified, transaction-level financial view.
Here's how accretion/dilution models are typically built and how Shortcut can expedite this entire workflow.
Part 1: Calculating Acquirer / Target Values and Assumptions
To illustrate the mechanics, let's walk through an example using Hayden's acquisition of HR Mobility.
Note: All figures below are purely illustrative and not reflective of the actual transaction.
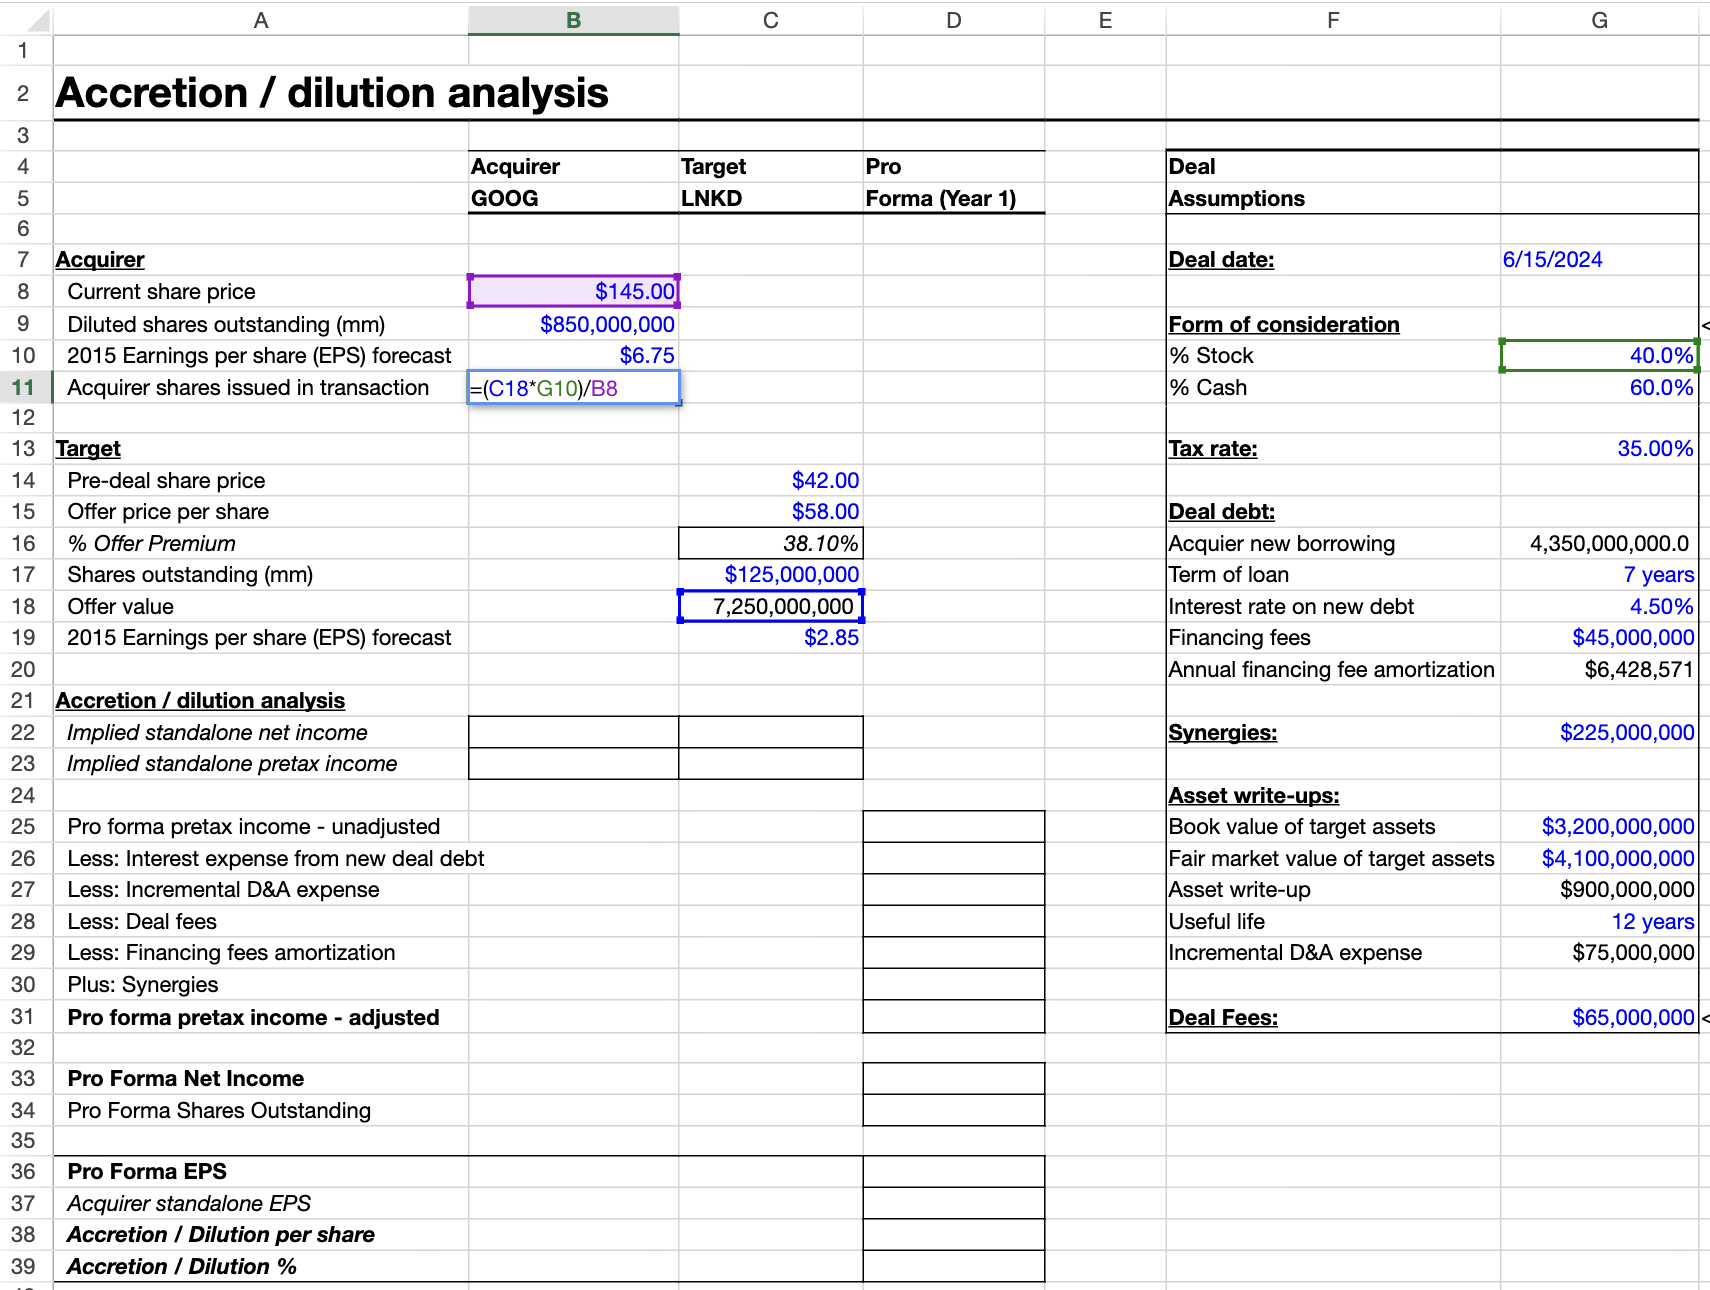
Example accretion/dilution analysis model structure
To calculate the number of acquirer shares issued in a transaction, bankers typically:
- Calculate the total offer value — the dollar amount the acquirer is paying for the target.
- Divide the offer value by the acquirer's current share price to estimate how many shares would be needed if the entire deal were financed with stock.
- Adjust for the actual stock consideration (i.e., percentage of the deal financed with stock) to determine the true number of new shares issued.
In excel, you would type =G10*C18/B8
Traditionally, performing this calculation requires plugging in assumptions, checking references, and manually sourcing figures from 10-Ks, S-1 filings, or Capital IQ.
- ~45 minutes to complete using an existing model
- 60–90 minutes if sourcing data manually
Shortcut automates your calculation in one prompt:
"Calculate the acquirer shares issued for me"
Shortcut breaks down the task into three steps:
- Calculates the offer value
- Applies the stock consideration
- Determines the final shares issued
In this example, in one prompt Shortcut was able to calculate:
Acquirer Shares Issued — Hayden / HR Mobility (Illustrative):
- Offer Value: $7,250,000,000 (125,000,000 target shares × $58 offer price)
- Stock Consideration: $2,900,000,000 (40% of offer value)
- Shares Issued: 20,000,000 ($2,900,000,000 ÷ $145 acquirer share price)
All formulas are fully dynamic—any changes to inputs (e.g., stock price or ownership percentages) automatically update the outputs.
This automation eliminates manual steps, reduces error risk, and significantly accelerates the deal modeling process.
45–90 minutes of manual work reduced to 30 seconds (90x faster).
Faster turnaround. Fewer errors. More time for strategic analysis.
Part 2: Accretion / Dilution Analysis
Once all key assumptions are set, the next step in an accretion/dilution analysis is to determine how the transaction impacts the acquirer's earnings per share (EPS).
At its core, this is done by calculating Pro Forma EPS for the combined company after the deal, and then comparing it to the acquirer's Standalone EPS.
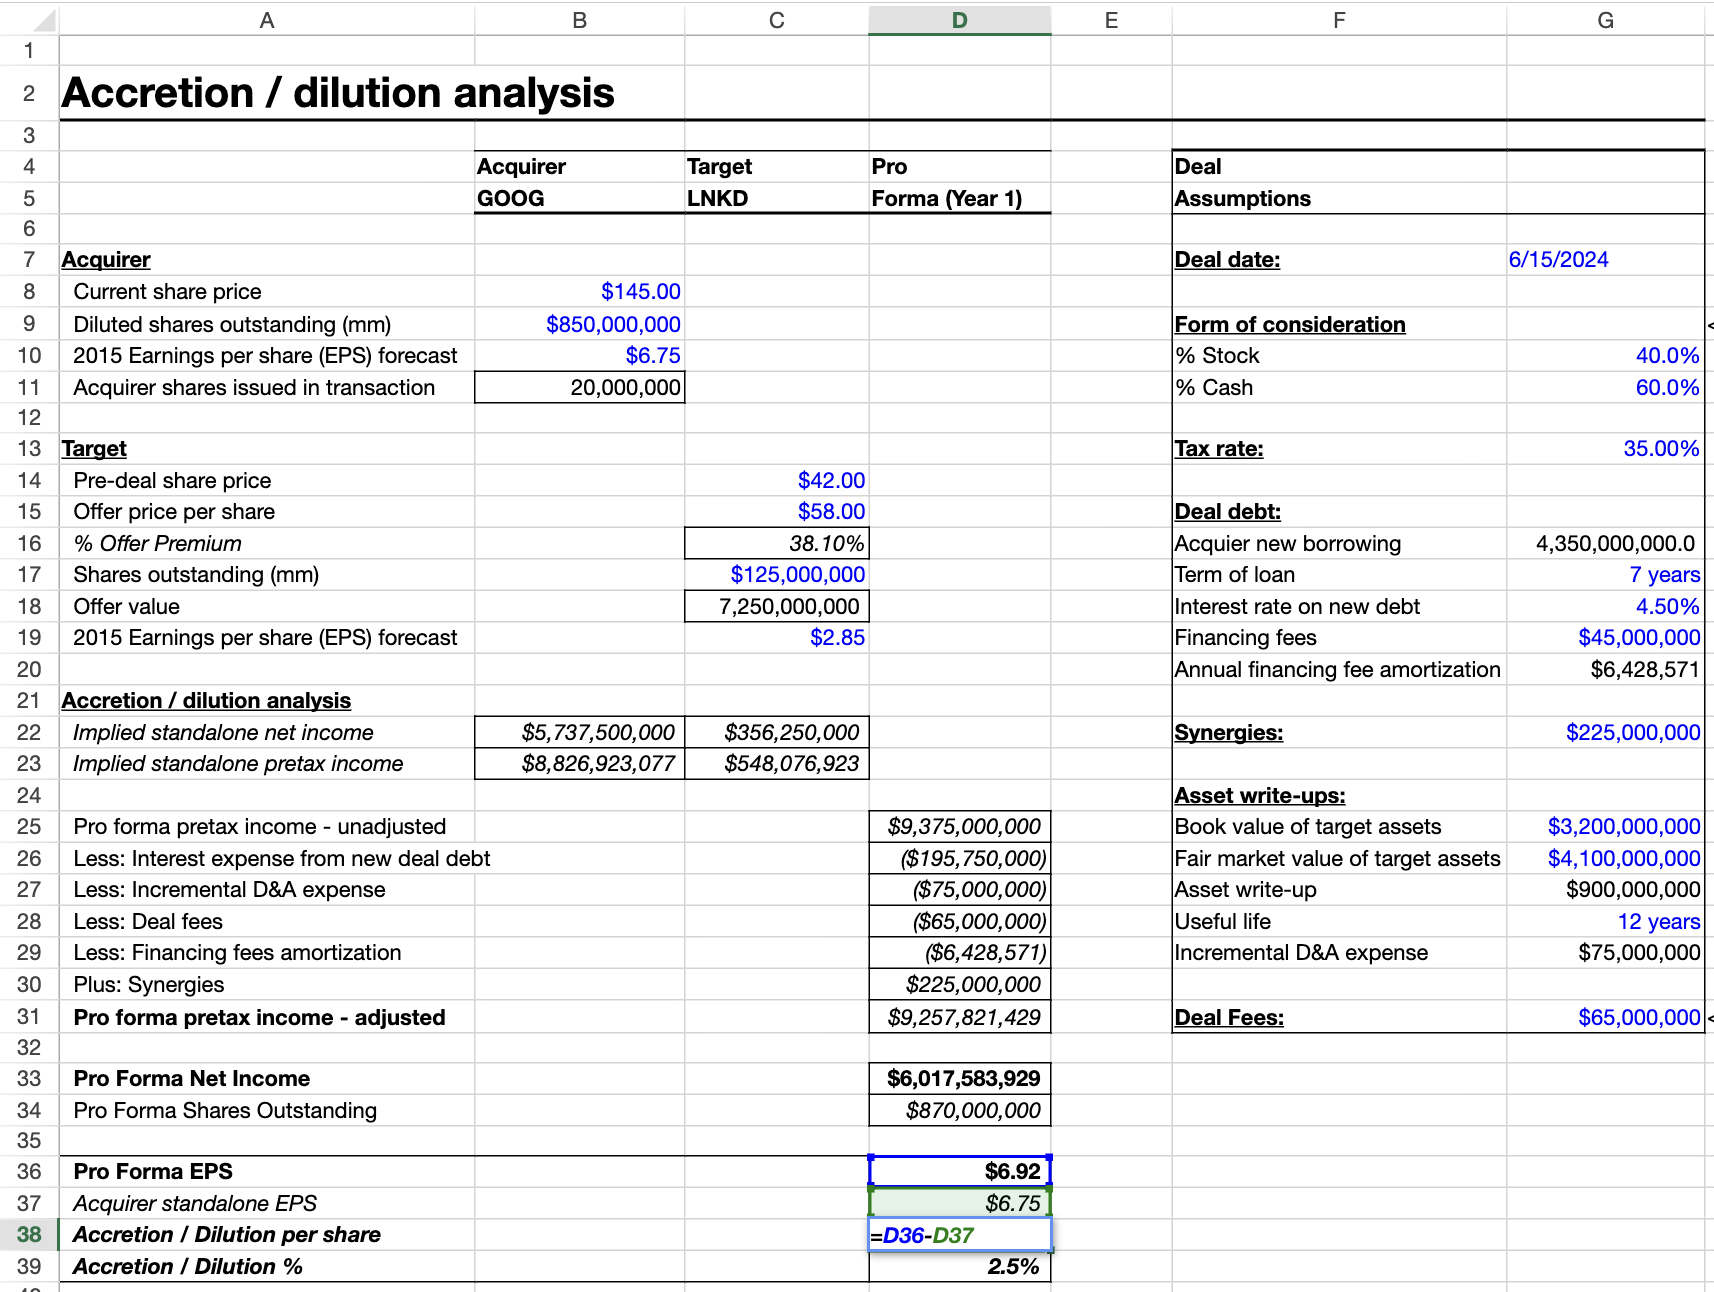
Detailed accretion/dilution calculation workflow
This calculation involves a series of structured steps, analysts typically:
- Start with each company's standalone pre-tax income, and if only net income is available, back into pre-tax using the tax rate.
- Combine the acquirer's and target's standalone pre-tax income to get total unadjusted pre-tax income.
- Adjust that figure to reflect deal economics—subtracting interest expense on new debt, incremental D&A, financing and deal fees, and adding projected synergies.
- Apply taxes to arrive at pro forma net income.
- Update the share count by adding new shares issued in the transaction to the acquirer's diluted shares outstanding.
- Calculate pro forma EPS by dividing pro forma net income by total pro forma shares.
- Compare this figure to the acquirer's standalone EPS to determine accretion or dilution per share.
A small change in assumptions—like increasing stock consideration—can meaningfully shift the outcome, since it affects the number of shares issued and ultimately pro forma EPS.
Traditionally, building this calculation manually takes:
- 45–75 minutes with an existing model
- 90–150 minutes when sourcing numbers and building from scratch
Shortcut will 70-225x your workflow. Simply type in:
"Calculate the accretion / dilution per share for me"
Shortcut completes the full accretion/dilution workflow by:
- Reading the model and identifying key inputs (offer value, stock mix, tax rate, synergies, fees, D&A, interest).
- Building the income bridge and applying tax.
- Updating share count automatically.
- Calculating pro forma EPS and comparing to standalone EPS.
- Calculated per-share and percentage accretion.
- Returning clean, formatted results.
In this example, Shortcut calculated:
- Implied Standalone Net Income: $356,250,000 (Shares outstanding × EPS forecast)
- Implied Standalone Pre-Tax Income: $9,375,000,000 (Net income / 1 - tax rate)
- Adjustments to Pre-Tax Income:
- −$196,000,000 interest expense
- −$75,000,000 incremental D&A
- −$71,428,571 deal & financing fees
- +$225,000,000 synergies
- Pro Forma Net Income: $6,017,583,928.57 (after tax)
- Pro Forma Shares: $870,000,000 ($850,000,000 diluted shares + $20,000,000 new shares)
- Pro Forma EPS: $6.92
- Standalone EPS: $6.75
- Accretion/Dilution: $0.17 per share (+2.47%)
Conclusion
With both shares issued (Part I) and accretion/dilution (Part II) automated, finance teams can:
- Test cash vs. stock structures and their EPS impact in real time.
- Back-solve maximum purchase price / EV-to-EBITDA multiple while maintaining accretion or IRR targets.
- Run sensitivities on synergies, cost of capital, or stock mix instantly.
- Support faster and more informed deal negotiation and valuation decisions.
Speed: 45–150 min manually → 40 sec with Shortcut
Accuracy: auto-calculated, linked, and formatted
Strategic Value: unlocks real-time scenario testing and pricing flexibility
With Shares Issued (Part I) and Accretion/Dilution (Part II) automated and linked, finance teams get a complete, decision-grade view of the deal—fast enough to explore real alternatives in live negotiations.
What You Can Decide Now:
Deal viability (near-term EPS lens):
Is the transaction acceptably accretive on your guidance horizon (e.g., ≥0–5% accretion in Year 1/2), or do terms/structure need to change?
Valuation & "What multiple can we pay?"
Back-solve the maximum purchase price / EV-to-EBITDA multiple that preserves your EPS accretion guardrail (or your ROIC/WACC hurdle). Shortcut turns the accretion result into a price/multiple envelope by toggling purchase price until EPS (or ROIC) constraints bind.
Structure optimization:
Trade cash vs. stock to balance dilution, leverage, and credit metrics; test earn-outs or contingent value rights; assess whether issuing more stock (to lower debt) helps or hurts EPS in your range.
Return profile:
Build a deal IRR / payback view using synergy timing, one-time costs, and purchase accounting to see if ROIC clears WACC + premium within your target window (e.g., 3–5 years).
Risk & sensitivity:
Sensitize synergy attainment, cost of debt, tax rate, stock price drift, and integration timing to understand the distribution of EPS outcomes (p10–p90) and where covenants or guidance risk could appear.
Why Shortcut Helps Here:
Speed → options:
Turning 3-4 hours of spreadsheet work into ~40 seconds lets you actually negotiate structure (cash/stock mix), pressure-test price, and brief leadership with multiple paths—not just one frozen scenario.
Accuracy → trust:
Inputs are validated; sign conventions and links are consistent; outputs are formatted and auditable. Less time reconciling, more time deciding.
Dynamic by design:
Change one assumption (e.g., synergies −10%, stock mix +10 pts), and the entire accretion/valuation picture updates instantly.
Key Takeaways
- 90x Faster - Complete accretion/dilution models in 40 seconds vs. 45-150 minutes
- Automated Calculations - Shares issued, pro forma EPS, and deal impact analysis
- Real-Time Scenario Testing - Test cash vs. stock structures instantly
- Dynamic Updates - All formulas automatically update when inputs change
- Decision Support - Optimize deal structure, pricing, and financing mix